Alpha, Beta and Power of Test in Hypothesis
Lets begin with the concept of
Null Hypotheses.
Assume that the statistical
parameters of the Sample set is different from that of the Population set. For
example, the population set is 200 students and the sample set is 50 students.
The mean of marks secured by the student is 85 in population set and 88 in the sample
set.
What can be concluded from the
difference in the value of mean? What can be concluded from this experiment?
It’s simple. Here are the conclusions:
- These 50 students are different from the population set of
200, hence their average score is different i.e. behavior of these
randomly selected 50 students sample is different from the population (or
these are two different population.)
- There is no difference at all. The result is due to random
chance only i.e. we found the average value of 88. It could have been
higher / lower than 88 since there are students having average score less
or more than 85.
Null Hypothesis (H0)
Null hypothesis states that the
sample is no different than the population set.
By default it is assumed that the
null hypothesis is valid until there is enough evidence to support rejecting
this hypothesis.
Alternative Hypothesis (H1)
Alternate Hypothesis states that
there is a difference between groups. The sample groups are different with
regard to the population set being studied.
According to the requirement of
the research, either Null Hypothesis is accepted or rejected. However, we never
prove that the alternative hypothesis is true. We can only reject a hypothesis
(say it is false) or fail to reject a hypothesis. So, if a researcher really
wants to prove that the Alternate hypothesis is true, s/h will have to reject
the null hypothesis, because that is as close as they can get to proving the
alternative hypothesis is true.
Type I and Type II Error
Every time we reject a Null Hypothesis,
there is a chance that we have made a mistake.
Type I Error: incorrectly rejecting
Null Hypothesis when it is true.
Type II Error: incorrectly
failing to reject the Null Hypothesis when it is actually false.
Power: rejecting the Null
hypothesis when it is actually false.
The probability of occurrence of Type I error is called alpha and the probability of occurrence of Type II error is called Beta.
Predicted
|
|||
False (0)
|
True (1)
|
||
Null
Hypothesis
|
False (0)
|
Power
1- β
|
Type
II Error
β
|
True (1)
|
Type
I Error
α
|
Confidence
1- α
|
|
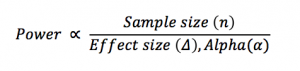
There are the following four
primary factors affecting power:
1.
Significance
level (or alpha)
2.
Sample size
3.
Variability,
or variance, in the measured response variable
4.
Magnitude of
the effect of the variable
As the alpha level is the
probability of making a Type I error, it seems to make sense that we make the
Type I error area as tiny as possible. For example, if we set the alpha level
at 10% then there is large (0.1) chance that we might incorrectly reject the
null hypothesis, while an alpha level of 1% would make the area tiny. So why
not use a tiny area instead of the standard 5%?
The smaller the alpha level, the
smaller the area where we would reject the null hypothesis. So if we have a
tiny area, there’s more of a chance that we will NOT reject the null, when in
fact you should. This is a Type II error. In other words, the more we try and
avoid a Type I error, the more likely a Type II error could creep in.
Scientists have found that an alpha level of 5% is a good balance between these
two issues.
Another example for demonstration
of Type I error and Type II error is below:
Null Hypothesis: the person is
not guilty
Predicted
|
|||
False (0)
NOT GUILTY
|
True (1)
GUILTY
|
||
Null
Hypothesis
|
False (0)
GUILTY
|
Type
II Error
β
|
|
True (1)
NOT GUILTY
|
Type
I Error
α
|
||
One more Example:
Here, Null Hypothesis is “there
is no wolf”
 |
| Source: https://theebmproject.files.wordpress.com/2017/11/type-1-and-2-wolves.jpg?w=500 |
Type I error (α): we
incorrectly reject the null hypothesis, that there is no wolf (i.e., we believe
there is a wolf), even though the null hypothesis is true (there is no
wolf).
Type II error (β): we
incorrectly fail to reject the null hypothesis (there is no wolf) even though
the null hypothesis is false (there is a wolf).
Reference:
https://www.analyticsvidhya.com/blog/2015/09/hypothesis-testing-explained/
https://www.statisticshowto.datasciencecentral.com/what-is-an-alpha-level/
https://theebmproject.wordpress.com/power-type-ii-error-and-beta/


Comments
Post a Comment