Confusion Matrix
A Confusion Matrix is a table that is
often used to describe the
performance of a classification model (or "classifier") on a set of test data for
which the true values are already known. The confusion matrix is relatively
simple to understand, once the related terminology are understood.
Let's
start with an example confusion matrix for a
binary classifier (it can also be easily extended to the case of more than
two classes):
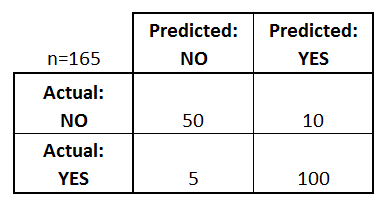
Lets
evaluate the matrix above.
- There are two possible predicted classes:
"Yes" and "No". If we were predicting the presence of
a disease, for example, "yes" would mean they have the disease,
and "no" would mean they don't have the disease.
- The classifier made a total of 165 predictions (e.g.,
165 patients were being tested for the presence of that disease).
- Out of those 165 cases, the classifier predicted
"yes" 110 times, and "no" 55 times.
- In reality, 105 patients in the sample have the
disease, and 60 patients do not.
Let's
now define the most basic terms, which are whole numbers (not rates):
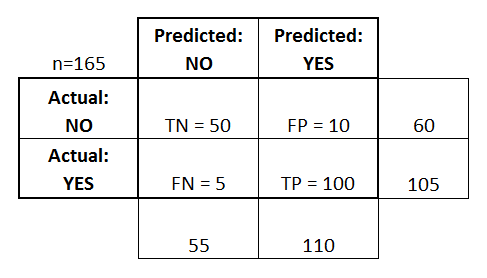
- True Positives (TP): These are cases in which we predicted “yes” (they
have the disease), and they do have the disease.
- True Negatives (TN): We predicted “No”, and they don't have the
disease.
- False Positives (FP): We predicted “yes”, but they don't actually have
the disease. This is also known as a "Type I error."
- False Negatives (FN): We predicted “No”, but they actually do have the
disease. This is also known as a "Type II error."
On
adding these terms to the confusion matrix, and also adding the row and column
totals, we get:
Lets be familiar with the terminologies now.
- Accuracy: Overall,
how often is the classifier correct?
This term denotes
how many times was the prediction correctly done. The total number of correct
predictions (True Positive and True Negative) is measured agianst the total
nubmer of predictions.
- (TP+TN)/total = (100+50)/165 = 0.91
- Error (Misclassification Rate): Overall, how often is it wrong?
This term denotes how many times was
the prediction incorrectly done. The total number of incorrect predictions (False
Positive and False Negative) is measured agianst the total nubmer of predictions.
- (FP+FN)/total = (10+5)/165 = 0.09
- It is equivalent to 1 minus Accuracy (1-0.91= 0.09)
- It is also known as "Error Rate"
- True Positive Rate: When
it's actually yes, how often does it predict yes?
The total number of “Yes”
predictions is measured agianst the actual nubmer of “Yes” occurences i.e. when
actual value is “Yes”, how often is the prediction correct.
- TP/(FN+TP)
- TP/actual yes = 100/105 = 0.95
- also known as "Sensitivity" or "Recall"
- False Positive Rate: When
it's actually no, how often does it predict yes?
- FP/(FN+TP)
- FP/actual no = 10/60 = 0.17
- True Negative Rate: When
it's actually “No”, how often does it predict “no”?
- TN/(TN+FP)
- TN/actual no = 50/60 = 0.83
- equivalent to 1 minus False Positive Rate (1-0.83=
0.17)
- also known as "Specificity"
- Precision: When
it predicts yes, how often is it correct?
It is the only term
where the denominator is taken from a single column rather than from a single column.
- TP/(FP+TP)
- TP/predicted yes = 100/110 = 0.91
- Prevalence: How
often does the yes condition actually occur in our sample?
- actual yes/total = 105/165 = 0.64
It
totally depends on the analysis format in order to determine which terminology
to focus on. Lets see these examples:
Spam Mail
Assume,
a classifier predicts that the mail is a Spam mail or not.
False
Negative: The mail is actually a Spam, but it is predicted not to be, and sent
to Inbox.
False
Positive: The mail is not a Spam and it is sent to Spam folder instead of the
Inbox. This situation is not desirable.
Having
a FN situation is acceptable as spam mail enters the Inbox. But a FP may cause
miss of important messages. So, in this case, we need to decrease the FP.
Hence, low value of Specificity is required in this case.
Fraud Detection
Assume,
a classifier predicts if the customer makes a fraud transaction or not.
False
Positive: Normal transaction is tagged as a Fraud transaction
False
Negative: Fraud transaction is tagged as a Normal transaction. This is not desired.
Case of FP is acceptable as on double check,
the authenticity of the transaction is found out and the company is in no loss
anyway. But in case of FN, a fraud transaction is mis-tagged as a Normal one
which is to be filtered.
Hence, FN is to be decreased, (i.e. TP is
to be increased) so, high value of Sensitivity is required here.
A couple other terms are also worth mentioning:
- Null Error Rate: This is how often you would be wrong if you always predicted the majority class. (In our example, the null error rate would be 60/165=0.36 because if you always predicted yes, you would only be wrong for the 60 "no" cases.) This can be a useful baseline metric to compare your classifier against. However, the best classifier for a particular application will sometimes have a higher error rate than the null error rate, as demonstrated by the Accuracy Paradox.
- Cohen's Kappa: This is essentially a measure of how well the classifier performed as compared to how well it would have performed simply by chance. In other words, a model will have a high Kappa score if there is a big difference between the accuracy and the null error rate.
- F Score: This is a weighted average of the true positive rate (recall) and precision.
- ROC Curve: This is a commonly used graph that summarizes the performance of a classifier over all possible thresholds. It is generated by plotting the True Positive Rate (y-axis) against the False Positive Rate (x-axis) as you vary the threshold for assigning observations to a given class.
Reference:


I am really enjoying reading your well written articles.
ReplyDeleteIt looks like you spend a lot of effort and time on your blog.
I have bookmarked it and I am looking forward to reading new articles. Keep up the good work.
Android Training Institute in Chennai | Android Training Institute in anna nagar | Android Training Institute in omr | Android Training Institute in porur | Android Training Institute in tambaram | Android Training Institute in velachery